
The Top 15 States Seeing the Biggest Equity Gains—Then vs. Now
By FMC Editorial Team
The estimated reading time for this post is 576 seconds
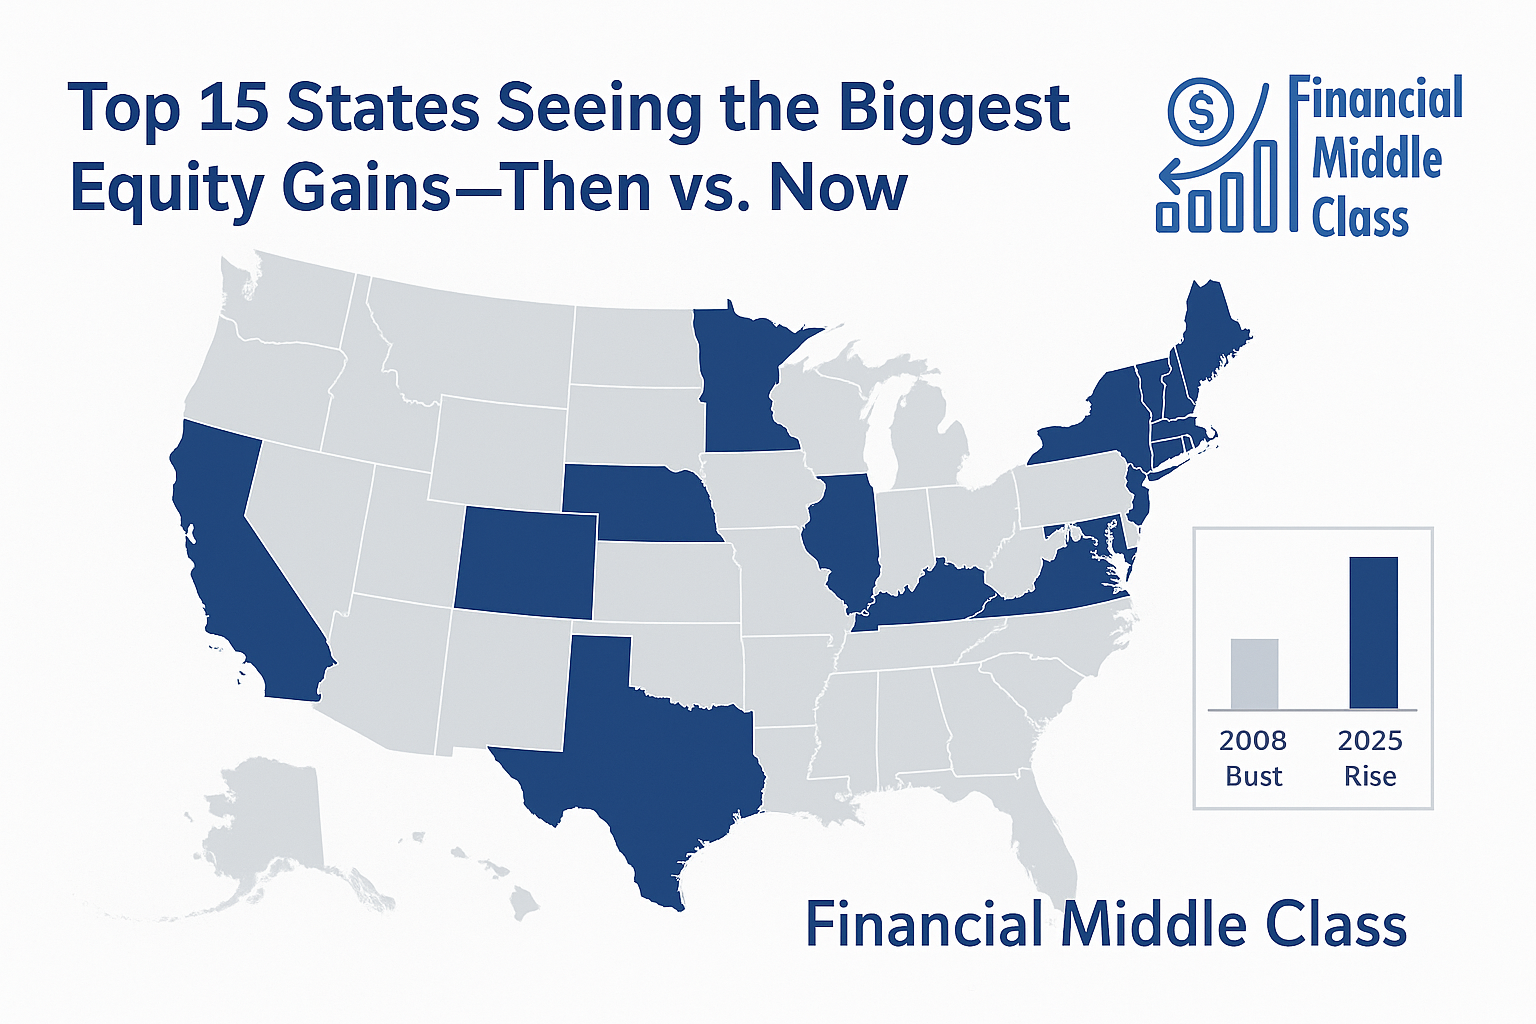
A handful of states—mostly in the Northeast and Midwest—are posting the strongest house-price gains right now. But before you treat rising equity like found money, remember how the last boom-and-bust punished households that borrowed against paper gains. Here’s the “then vs. now” you need to see, plus what to do about it.
Mortgage rates eased a touch from the peak—mid-6s lately—not cheap, not deadly. That small move, paired with a mountain of accumulated equity, is enough to wake up cash-out refis again. The national equity pie is massive, and the distribution is shifting: the states with the fastest recent price gains are led by New York, Connecticut, and New Jersey, with a broader bench of Northeastern and Midwestern markets not far behind. That’s not where the last cycle’s fireworks were. And that matters.
Before we get tactical, let’s set terms:
- Equity = home value minus mortgage debt.
- Tappable equity = the portion you can borrow while staying at ≤80% LTV.
- Our “Now” window = Q2 2024 → Q2 2025, using FHFA’s state HPI (purchase-only, seasonally adjusted).
- Our “Then” window = the 2005–2007 peak through the 2011–2012 trough—the Great Financial Crisis (GFC) era—using FHFA research and historical recovery snapshots for context.
Methodology
- Ranking “Top 15”: We use FHFA’s state 12-month appreciation table for 2025 Q2. It ranks states by annual price change; we use that as a clean, replicable proxy for recent equity acceleration at the state level.
- Historical comparison: For the GFC, we reference FHFA/Urban Institute summaries indicating peak-to-trough behavior by state/region (which states fell hardest, which lagged the longest). Where exact state peak-to-trough figures aren’t published in a single current table, we cite division-level and documented state examples (e.g., CT and NJ remained below their 2007 peaks well into 2017; NV/CA were among the deepest busts; TX was comparatively mild). The point: how these Top-15 states behaved then vs. now.
- Why FHFA? It’s the broad, public, repeat-sales benchmark across all 50 states—transparent and consistent.
National Backdrop: Why the Map Looks Different This Time
- Prices up, but uneven: U.S. house prices rose 2.9% year-over-year through Q2 2025, with the Middle Atlantic division leading (think NY/NJ/PA), and the Pacific posting the weakest gains. That alone tells you the geography of heat flipped from the last cycle.
- Equity stockpile: Mortgage holders entered 2025 with roughly $17T in total home equity and ~$11T tappable equity—near records—fueling renewed second-lien/HELOC and cash-out activity despite rates in the 6s.
- Equity-rich concentration: The Northern New England trio—Vermont, New Hampshire, Maine—tops the nation in the share of “equity-rich” homes (loan ≤50% of value), dovetailing with our Top-15 list below.
- “Then vs. now” mechanics: During the GFC, real home prices fell nationally by ~32%, with CA and NV plunging far deeper; TX fell only about 12% in real terms. Today’s leaders (NY/CT/NJ/ME/NH/RI/PA/IL/WI/OH, etc.) are not the classic “Sand States” that drove 2006–12 volatility. That’s a crucial difference.
The Top 15 States (2025 Q2): “Now” vs. “Then”
Below: each state’s latest 12-month price change (“Now,” Q2-to-Q2), a concise GFC-era note (“Then”), the parallel or difference, and what a homeowner should do with that context.
Source for “Now”: FHFA state table for 2025 Q2.
1) New York — +8.0% YoY
Then (GFC): NY avoided the extreme boom-bust of NV/AZ/CA. Downturns were real but more muted than the Sand States; recoveries varied by metro (NYC boroughs vs. upstate). Slow, steady best describes much of the post-2012 climb.
Difference now: NY is leading national gains thanks to tight inventory, income density, and a post-pandemic re-pricing of “drivable” metros and suburban/rural spillovers.
Do this: If you tap equity, keep ≤80% LTV, and treat cash-out like a surgical tool—debt triage or resilience upgrades—not lifestyle creep.
2) Connecticut — +7.8%
Then: CT is a poster child for long stagnation. As late as 2017, prices were still ~14% below their 2007 peak—one of the slowest recoveries in the country.
Difference now: Momentum flipped; CT’s late-cycle strength reflects suburban demand, limited building, and spillovers from NY/MA.
Do this: Avoid turning a long-awaited rebound into long-term debt. If consolidating cards, freeze the cards post-refi to prevent re-loading.
3) New Jersey — +7.5%
Then: Like CT, NJ lagged: as of 2017, NJ still sat ~11% below its 2007 peak. Recovery was slow, uneven, dragged by legacy foreclosure inventories.
Difference now: NJ’s outperformance tracks tight inventory and commuter-belt demand.
Do this: If you refinance above your old rate, add automatic principal curtailments to preserve your original payoff date.
4) Mississippi — +7.3%
Then: MS didn’t experience the extreme 2006–12 whipsaw of Western boom states.
Difference now: Gains reflect relative affordability, stable in-migration, and limited speculative building.
Do this: Insurance volatility matters across the Gulf—budget rising premiums before hiking your mortgage payment.
5) Illinois — +6.7%
Then: Chicago-area distress was real—values fell and took time to recover—though not on NV/FL/CA scale.
Difference now: IL’s gains are a late-cycle catch-up story amid thin supply.
Do this: If cash-out, require a ≤36-month breakeven (fees ÷ monthly savings) or don’t do it.
6) Maine — +6.0%
Then: ME didn’t mirror the Sand States’ bust; declines were more contained.
Difference now: ME is equity-rich territory—aging stock, lifestyle migration, and constrained supply all support prices.
Do this: HELOCs can work for phased projects; stress-test rates +2–3% before committing.
7) New Hampshire — +6.0%
Then: Similar to ME—no catastrophic bust, slower and steadier path.
Difference now: Top-tier equity-rich share and spillover from Greater Boston drive price strength.
Do this: Keep combined LTV ≤80% and hold 6+ months cash after closing—equity is not an emergency fund.
8) Wisconsin — +5.8%
Then: The Midwest bust was milder than the West, but many markets still struggled through 2012.
Difference now: Affordability, job stability in key metros (Madison, Milwaukee region), and under-building underpin prices.
Do this: For debt consolidation, close/freeze high-APR cards after payoff to avoid the classic “double-debt” trap.
9) Rhode Island — +5.7%
Then: RI felt New England’s downturn but not the Sand State collapse; recovery lagged Boston’s heat.
Difference now: Low inventory + coastal draw + Boston spillover.
Do this: Cosmetic remodels rarely “pay for themselves”; favor energy/roof/window upgrades with measurable ROI.
10) North Dakota — +5.4%
Then: ND actually soared above its 2007 peak by 2017 thanks to the oil boom, then cooled as energy normalized.
Difference now: Gains look orderly, not speculative; watch local employment/energy cycles.
Do this: Avoid 30-year resets for short-term needs; second-lien home-equity loans can keep a low-rate first intact.
11) Ohio — +5.3%
Then: The industrial Midwest took a hit in the GFC, but not at Sunbelt bubble magnitudes.
Difference now: Structural affordability and job growth in select metros are lifting prices.
Do this: If you must borrow, keep your breakeven ≤24–36 months and automate principal.
12) Kentucky — +4.9%
Then: KY’s cycle was less violent than the coasts.
Difference now: Gains are affordability-driven; supply is thin relative to new household formation.
Do this: Prefer fixed-rate seconds over variable HELOCs if budget is tight.
13) Wyoming — +4.8%
Then: Small, volatile inventory; energy cycles mattered more than subprime exposure.
Difference now: Price strength is steady; liquidity is thin—don’t over-leverage in small markets.
Do this: Preserve optional prepayment; even $100–$300/month toward principal shortens your horizon meaningfully.
14) Pennsylvania — +4.8%
Then: PA avoided the biggest bubble; losses were moderate relative to national crash leaders.
Difference now: East-coast spillovers and solid wage dynamics support gains.
Do this: If refinancing from a very low legacy rate, make extra principal non-negotiable to protect your payoff date.
15) New Mexico — +4.6%
Then: NM was an early-boom leader in the mid-2000s (per 2007 OFHEO tables), then cooled; not a top negative-equity epicenter.
Difference now: Gains are measured, supported by relocations and tight supply rather than speculative flipping.
Do this: Keep cash reserves ≥6 months after closing; equity ≠ liquidity.
Patterns & Parallels You Shouldn’t Ignore
1) New leaders, new risks.
Today’s top gainers skew Northeast/Midwest, not the 2006-style Western/Sunbelt hotbeds. That doesn’t make them risk-free. Insurance pressures (coastal New England, Mid-Atlantic flood risk) and local tax dynamics can erode affordability even when values rise.
2) Equity-rich ≠ crash-proof.
Vermont, New Hampshire, and Maine lead in equity-rich share, but borrowing against that cushion is still borrowing. Treat refis and HELOCs like scalpels, not sledgehammers.
3) The GFC lesson still holds.
The national real price drop was ~32% in the last bust. California and Nevada fell much more; Texas fell far less. The “lesson” isn’t that your state is immune—it’s that behavior (loan terms, LTV discipline) is the difference between resilience and regret.
Practical Playbook (Use This Before You Tap Equity)
- Know your number. Pull current LTV and combined LTV with any second lien; target ≤80% post-close.
- Pick the right instrument.
- HELOC for phased expenses; stress-test +200–300 bps for rate shocks.
- Fixed second if you need a lump sum and rate certainty, while keeping a low-rate first.
- Cash-out refi only if it reduces risk (e.g., ARM reset) and breakeven ≤36 months.
- HELOC for phased expenses; stress-test +200–300 bps for rate shocks.
- Stop the double-debt trap. If consolidating cards, close/freeze them, set autopay statement-balance, and track cash-flow weekly.
- Insure reality. In coastal or severe-weather states, price in insurance jumps before adding to the monthly.
- Make a payoff date—and automate principal curtailments so your debt horizon shortens, not stretches.
What’s Different This Time—And What Isn’t
- Different: The geographic leadership of price gains has rotated; underwriting rules are tighter post-Dodd-Frank; speculative new-build overhangs are smaller in many of today’s hot states.
- Same: Turning paper gains into bigger, longer loans can still wreck your financial plan if you don’t control spending and principal. Headline equity doesn’t make payments.
Sources (Most-recent & Load-bearing)
- FHFA HPI Q2 2025 report: national + state tables; Middle Atlantic leads; full Top-15 (NY→NM) with YoY %s.
- FHFA datasets overview (methodology).
- ICE Mortgage Monitor (Sept 2025 / Mar 2025): total/tappable equity near records; HELOC/cash-out dynamics.
- ATTOM Q2 2025 equity-rich by state (VT/NH/ME leading).
- Urban Institute (2017) state recovery note: CT and NJ still below 2007 peaks as of 2017; NV furthest below.
- FHFA research (2023): Real price declines in GFC (~32% national; CA/NV deeper; TX milder).
Master Table (Top-15 Snapshot)
| Rank | State | YoY Price Change (Q2’24→Q2’25) | “Then” (GFC 2006–12) | Now vs. Then (1–2 lines) |
| 1 | New York | 8.0% | Moderate downturn vs. Sand States; metro-by-metro recovery | Leadership flipped to Northeast; tight supply rules. |
| 2 | Connecticut | 7.8% | Still ~14% below 2007 peak as of 2017 | Late-cycle catch-up; don’t squander it with cash-out sprawl. |
| 3 | New Jersey | 7.5% | Still ~11% below 2007 peak as of 2017 | From laggard to leader; inventory scarcity drives gains. |
| 4 | Mississippi | 7.3% | Smaller boom-bust; steadier line | Gains look fundamental; budget insurance. |
| 5 | Illinois | 6.7% | Real downturn, long recovery; not Sand-State deep | Catch-up; insist on ≤36-mo breakeven. |
| 6 | Maine | 6.0% | Contained bust | Equity-rich; HELOC works if rate-stress-tested. |
| 7 | New Hampshire | 6.0% | Contained bust | Equity-rich; protect LTV and reserves. |
| 8 | Wisconsin | 5.8% | Midwest slump but milder than West | Affordability + under-building = support. |
| 9 | Rhode Island | 5.7% | New England lull; lagged Boston | Low inventory + coastal premium. |
| 10 | North Dakota | 5.4% | Above 2007 peak by 2017 (oil boom) | Orderly now; watch energy cycles. |
| 11 | Ohio | 5.3% | Industrial Midwest hit; not Sunbelt deep | Structural affordability wins. |
| 12 | Kentucky | 4.9% | Less violent cycle | Rate certainty > teaser variable. |
| 13 | Wyoming | 4.8% | Energy-cycle sensitivity | Don’t over-leverage in thin markets. |
| 14 | Pennsylvania | 4.8% | Moderate downturn; quicker normalization | East-coast spillovers; keep payoff date. |
| 15 | New Mexico | 4.6% | Was a 2006–07 appreciator; later cooled | Gains look measured, not bubbly. |
The Bottom Line (Read This Twice)
- Equity is a tool, not income. Your house is not an ATM.
- Today’s leaders are different than last cycle’s, but the behavioral risk is the same: stretching your mortgage because prices are up today.
- If you tap equity, do it to lower risk and shorten your timeline, not extend it. Treat any loan as a bridge to a better balance sheet, not a way to fund lifestyle inflation.
Resources

RELATED ARTICLES
How Wealth Is Passed Across Generations in the United States: Mechanisms, Evidence, and the Policy Debate
How wealth passes between generations—trusts, taxes, and the debate. Get the facts, figures, and tradeoffs. Read now.
The S&P 7,000: How Wall Street Disconnects from Main Street
S&P 7,000 can rise while wages, benefits, and towns fall behind. See why the market isn’t the economy—read now.
Leave Comment
Cancel reply
Gig Economy
American Middle Class / Feb 18, 2026
How Wealth Is Passed Across Generations in the United States: Mechanisms, Evidence, and the Policy Debate
How wealth passes between generations—trusts, taxes, and the debate. Get the facts, figures, and tradeoffs. Read now.
By FMC Editorial Team
American Middle Class / Feb 16, 2026
The S&P 7,000: How Wall Street Disconnects from Main Street
S&P 7,000 can rise while wages, benefits, and towns fall behind. See why the market isn’t the economy—read now.
By MacKenzy Pierre
American Middle Class / Feb 16, 2026
The “Resilient Consumer” Is Real—But So Is the Interest Bill
Credit card balances are rising as savings fall. See what it means—and the 30/60/90 plan to escape 25% APR debt.
By Article Posted by Staff Contributor
American Middle Class / Feb 09, 2026
What To Do If You Get Fired With an Outstanding 401(k) Loan
Fired with a 401(k) loan? Avoid taxes, offsets, and deadline traps with this step-by-step checklist. Read now.
By Article Posted by Staff Contributor
American Middle Class / Feb 09, 2026
The Real Math of Money in Relationships
Split finances without resentment. Any couple, any income ratio. Use the worksheet + rules—start today.
By Article Posted by Staff Contributor
American Middle Class / Feb 03, 2026
Investing or Paying Off the House?
Invest or pay off your mortgage? See a $500k example with today’s rates, dividends, and peace-of-mind math—then choose your plan.
By Article Posted by Staff Contributor
American Middle Class / Jan 30, 2026
Gold, Silver, or Bitcoin? Start With the Job—Not the Hype
Gold, silver or Bitcoin? Learn what each is for—and how to size it—before you buy. Read the framework.
By Article Posted by Staff Contributor
American Middle Class / Jan 29, 2026
Florida Homeowners Pay the Most in HOA Fees
Florida HOA fees are surging. See what lawmakers changed, what’s next, and how to protect your budget—read before you buy.
By Article Posted by Staff Contributor
American Middle Class / Jan 29, 2026
Why So Many Homebuyers Are Backing Out of Deals in 2026
Why buyers are backing out of home deals in 2026—and how to avoid costly surprises. Read the playbook before you buy.
By Article Posted by Staff Contributor
American Middle Class / Jan 28, 2026
How Money Habits Form—and Why “Self-Control” Is the Wrong Villain
Learn how money habits form—and how to rewire spending and saving using behavioral science. Read the framework and start today.
By FMC Editorial Team
Latest Reviews
American Middle Class / Feb 18, 2026
How Wealth Is Passed Across Generations in the United States: Mechanisms, Evidence, and the Policy Debate
How wealth passes between generations—trusts, taxes, and the debate. Get the facts, figures, and tradeoffs....
American Middle Class / Feb 16, 2026
The S&P 7,000: How Wall Street Disconnects from Main Street
S&P 7,000 can rise while wages, benefits, and towns fall behind. See why the market...
American Middle Class / Feb 16, 2026
The “Resilient Consumer” Is Real—But So Is the Interest Bill
Credit card balances are rising as savings fall. See what it means—and the 30/60/90 plan...