
The “Poorest City in Every State” Depends on What You Mean by Poor
By Article Posted by Staff Contributor
The estimated reading time for this post is 505 seconds
People love to ask, “What’s the poorest city in my state?” like there’s one official answer sitting on a shelf next to the weather report. But “poorest” is not a single measurement. It’s a story you choose to tell with a stat you choose to trust.
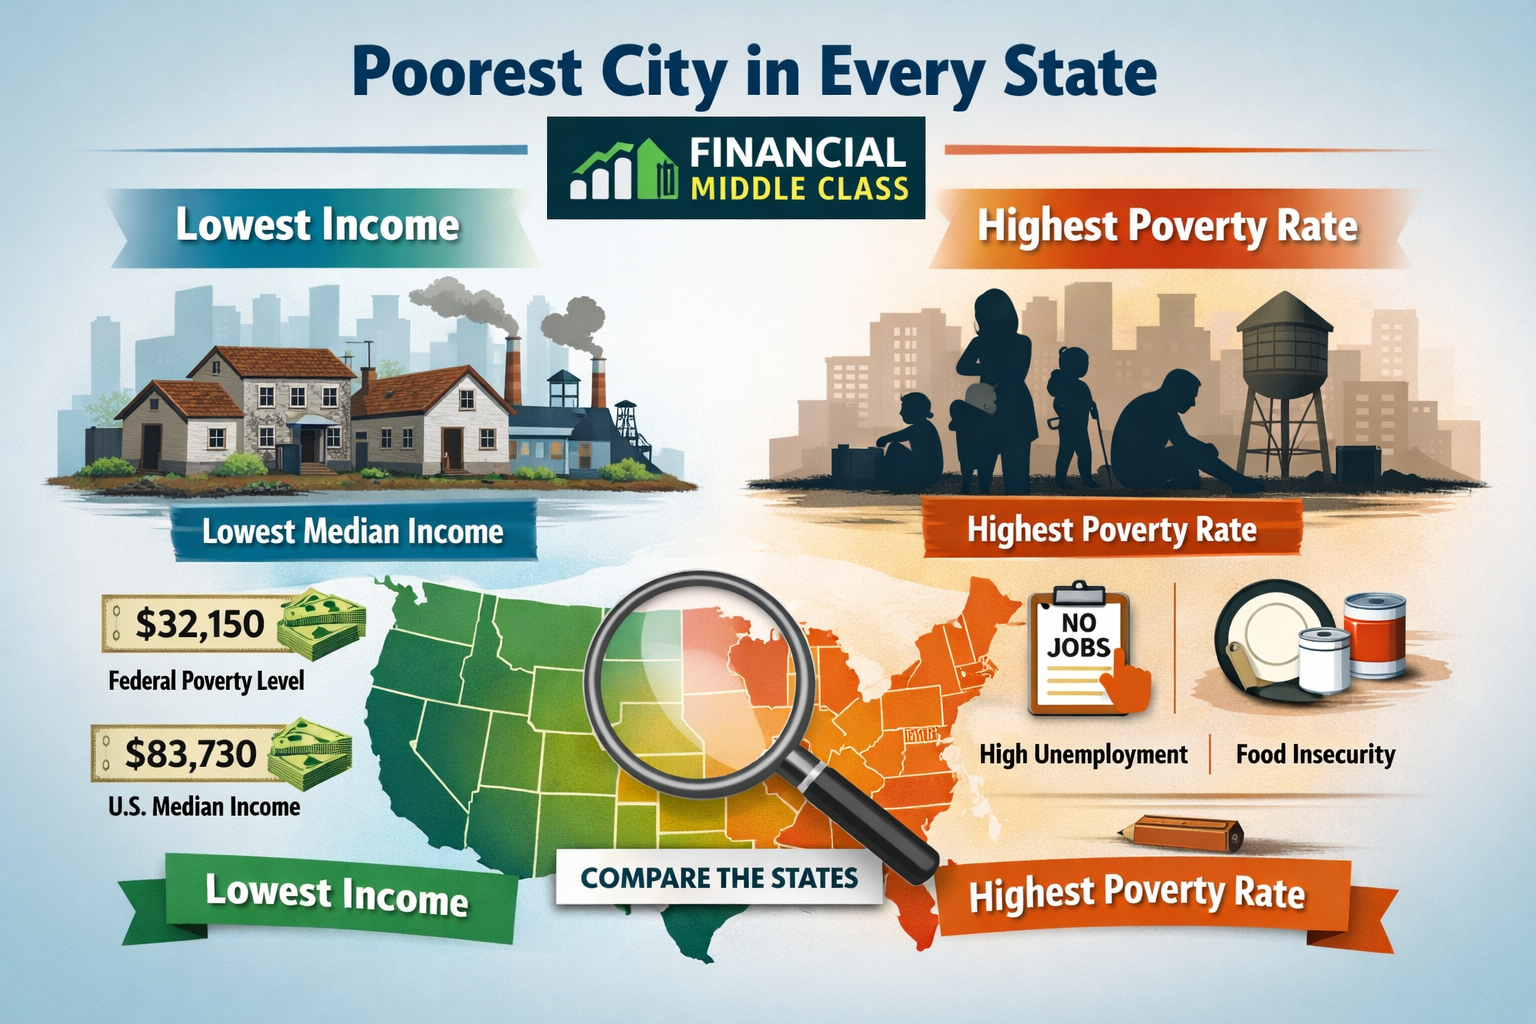
Here are the two national reference points that keep this conversation honest. The federal poverty guideline for a family of four is about $32,150.
The median household income in the United States in 2024 was $83,730.
So when somebody says “poorest,” you have to ask: are we talking about a place where the typical household earns the least, or a place where the largest share of residents fall under the poverty line?
Those two answers are sometimes the same. Often, they’re not. And that gap is where the real truth lives.
Two definitions, two different “poorest cities”
If you only read one table in this whole article, make it this one. Because this is the fork in the road.
| What you’re measuring | “Poorest” means… | What it catches well | What it can miss |
|---|---|---|---|
| Lowest median household income | The typical household earns the least | Places where paychecks are small and the middle is thin | A city can have low median income but still not have the highest poverty rate |
| Highest poverty rate | The largest share of residents are below the poverty line | Places where hardship is most concentrated | College towns and student-heavy cities can look “poorer” on paper than they feel on the ground |
And yes, the government poverty line matters as a baseline, but it’s not the same thing as “middle class,” and it definitely isn’t the same thing as “comfortable.” That’s why anchoring to both the poverty guideline and the national median is so useful.
Where this data comes from (and why that matters)
This article uses five-year American Community Survey (ACS) 2023 estimates to build a clean, state-by-state comparison.
For the lowest median household income pick in each state, the underlying approach uses ACS five-year estimates and only considers places with 50,000+ residents.
For the highest poverty rate pick in each state, it also uses ACS five-year estimates, but considers places with 45,000+ residents.
That population threshold detail is not nerd trivia. It changes the playing field. It’s why Vermont drops out of the high-poverty list in the source methodology, and why a few states effectively have a “poorest by default” outcome when only one city meets the cutoff.
So don’t use this to dunk on small towns. This is about comparably-sized places, measured consistently.
The headline finding: in 54% of states, “poorest” changes when you change the metric
When you line up “lowest median income” next to “highest poverty rate,” you get a simple, powerful result:
| Outcome | Number of states | Share of states |
|---|---|---|
| Same city is both lowest-income and highest-poverty | 23 | 46% |
| Different cities (metric changes the answer) | 27 | 54% |
That’s the whole point of this article. Most of the time, your answer depends on your definition.
If you’re a policy person, this is a targeting issue. If you’re a relocation person, this is a quality-of-life issue. If you’re a middle-class person trying to survive inflation, this is a “stop making decisions off vibes” issue.
When the numbers agree, it looks like what you expect
There are cities where the “lowest income” and “highest poverty rate” labels land in the same place, and the numbers read like a warning label.
Youngstown, Ohio is a perfect example. In the underlying high-poverty data, Youngstown shows a poverty rate of 36.2% and a median household income of $34,746.
That’s not a “rough patch.” That’s an ecosystem problem.
Here’s a side-by-side snapshot of several places in your dataset where low typical income and high hardship travel together.
| City | State | Median household income (ACS 2023 5-yr) | Poverty rate | Income as % of U.S. median (2024) | Income as multiple of FPL (family of 4) |
|---|---|---|---|---|---|
| Youngstown | OH | $34,746 | 36.2% | 41.5% | 1.08× |
| Flint | MI | $36,194 | 34.4% | 43.2% | 1.13× |
| Gary | IN | $37,380 | 32.9% | 44.6% | 1.16× |
| Camden | NJ | $40,450 | 28.5% | 48.3% | 1.26× |
Read that slowly. A “typical” household in these cities is living on something that’s barely above the poverty guideline for a family of four—and far below the national median household income.
This is where the middle class usually gets squeezed the hardest. Not because nobody is succeeding there, but because the floor is low, the ladders are fewer, and the margin for error is basically gone.
When the numbers disagree, the story gets smarter (and a little uncomfortable)
Now for the part that messes with people’s assumptions.
A city can have a very high poverty rate and still not be the lowest-income city in the state. Sometimes, that’s because of real concentrated hardship. Other times, it’s because of who lives there and how the poverty statistic is calculated.
Let me show you what I mean with six cities that make this point in different ways.
| Highest-poverty city | State | Poverty rate | Median household income | Bachelor’s attainment (from source) |
|---|---|---|---|---|
| Blacksburg | VA | 42.8% | $48,070 | 69.7% |
| Boulder | CO | 21.8% | $85,364 | 76.8% |
| Iowa City | IA | 26.3% | $57,533 | 60.7% |
| Manhattan | KS | 26.1% | $58,441 | 52.1% |
| Stillwater | OK | 29.4% | $42,015 | 51.9% |
| Corvallis | OR | 25.9% | $63,807 | — |
If you’re staring at Blacksburg’s 42.8% poverty rate thinking, “So Blacksburg must be the most economically broken place in Virginia,” that’s exactly why this article exists. The same source shows Blacksburg with extremely high bachelor’s attainment.
That combination—high poverty rate plus high education—often shows up in places where a lot of residents have low current income because they’re students or early-career, even if the area itself has strong institutions and long-term earning power.
This doesn’t mean poverty “isn’t real.” It means the poverty rate can be a loud alarm that needs interpretation before you make it your whole conclusion.
The “relative poor” problem: in some states, the “poorest city” still isn’t poor
Here’s another brain-twist: “poorest in the state” can still be above the national median in high-income states.
In the highest-poverty list methodology, Alaska’s identified city shows a median household income of $98,152.
That’s higher than the U.S. median household income of $83,730 in 2024.
So yes, a place can be “poorest” in-state and still be doing better than what most American households bring in. That’s why national anchors matter.
Here’s a simple side-by-side that keeps you from embarrassing yourself at the cookout.
| City | Why it shows up | Median household income | Poverty rate (if applicable) | What the number really tells you |
|---|---|---|---|---|
| Anchorage, AK | “Highest poverty” by default threshold in source list | $98,152 | 9.3% | Alaska’s baseline incomes are high; “poorest” is relative here |
| Youngstown, OH | High poverty and low income | $34,746 | 36.2% | Deep hardship is widespread and typical income is near-poverty |
| Boulder, CO | High poverty rate with high incomes | $85,364 | 21.8% | Poverty rate is elevated, but the city also has strong earning power |
This is why “poorest” is not a dunk. It’s a diagnosis.
What this means for the Financial Middle Class
Too many of you treat city economics like sports rankings. You want a single winner and a single loser. But if you’re trying to build a stable life—buy a home, raise kids, stack savings, maybe start a business—you need the profile, not the headline.
A middle-class decision isn’t “Is this city poor?” A middle-class decision is “Can I earn enough here, keep enough here, and grow enough here to stop living one crisis away from the edge?”
That’s why I like translating the data into two questions you can actually use.
Question one: how far is this city from the American middle?
The U.S. median household income in 2024 is $83,730.
So a city sitting at $42,000–$50,000 isn’t just “a little lower.” It’s operating in a different reality. That affects everything: the job market, the tax base, the school system, the rent-to-income math, the ability to absorb a car repair without turning it into a credit-card crisis.
Question two: how close is the typical household to the poverty line?
The federal poverty guideline for a family of four is about $32,150.
When a city’s median household income is only 1.1× to 1.3× that level, you’re looking at a place where a lot of households are living with almost no margin. That’s not “poor people somewhere else.” That’s the exact conditions that create middle-class fragility—because the middle can’t breathe.
The FMC test you can run on any city (without becoming a data scientist)
Here’s the mental model.
| The number | What it tells you | Why you should care |
|---|---|---|
| Median household income | What the “typical” household brings in | This is the paycheck environment you’re stepping into |
| Poverty rate | How widespread hardship is | This is the stress level in the local economy |
| Income vs U.S. median | How far you are from the American middle | This is how “normal” your city will feel compared to national life |
| Income vs poverty guideline | How thin the margin is | This is how close the typical household is to falling apart financially |
Notice what’s missing: vibes, politics, and “I heard it’s up and coming.”
That stuff can matter, but it can’t replace math.
So… what’s the poorest city in every state?
It depends on what you mean—so I’m giving you both answers, side-by-side, using the dataset you generated.
If you want to sort and filter this yourself, poorest_vs_poverty_city_by_state
Closing: don’t confuse a statistic for a life sentence
If your city shows up on the lowest-income list, that doesn’t mean you can’t win there. It means you have to be more intentional about your income strategy, your career runway, and your emergency fund because the local economy may not be designed to catch you when you slip.
If your city shows up on the highest-poverty list, don’t automatically assume it’s hopeless. Sometimes that signal is concentrated hardship that deserves attention and resources. Sometimes it’s a student-heavy place where the poverty rate is a loud number that needs context before it becomes a label.
Either way, the middle-class move is the same: stop letting one headline do the thinking for you. Use the right measure for the question you’re actually trying to answer.

RELATED ARTICLES
How Wealth Is Passed Across Generations in the United States: Mechanisms, Evidence, and the Policy Debate
How wealth passes between generations—trusts, taxes, and the debate. Get the facts, figures, and tradeoffs. Read now.
The S&P 7,000: How Wall Street Disconnects from Main Street
S&P 7,000 can rise while wages, benefits, and towns fall behind. See why the market isn’t the economy—read now.
Leave Comment
Cancel reply
Gig Economy
American Middle Class / Feb 18, 2026
How Wealth Is Passed Across Generations in the United States: Mechanisms, Evidence, and the Policy Debate
How wealth passes between generations—trusts, taxes, and the debate. Get the facts, figures, and tradeoffs. Read now.
By FMC Editorial Team
American Middle Class / Feb 16, 2026
The S&P 7,000: How Wall Street Disconnects from Main Street
S&P 7,000 can rise while wages, benefits, and towns fall behind. See why the market isn’t the economy—read now.
By MacKenzy Pierre
American Middle Class / Feb 16, 2026
The “Resilient Consumer” Is Real—But So Is the Interest Bill
Credit card balances are rising as savings fall. See what it means—and the 30/60/90 plan to escape 25% APR debt.
By Article Posted by Staff Contributor
American Middle Class / Feb 09, 2026
What To Do If You Get Fired With an Outstanding 401(k) Loan
Fired with a 401(k) loan? Avoid taxes, offsets, and deadline traps with this step-by-step checklist. Read now.
By Article Posted by Staff Contributor
American Middle Class / Feb 09, 2026
The Real Math of Money in Relationships
Split finances without resentment. Any couple, any income ratio. Use the worksheet + rules—start today.
By Article Posted by Staff Contributor
American Middle Class / Feb 03, 2026
Investing or Paying Off the House?
Invest or pay off your mortgage? See a $500k example with today’s rates, dividends, and peace-of-mind math—then choose your plan.
By Article Posted by Staff Contributor
American Middle Class / Jan 30, 2026
Gold, Silver, or Bitcoin? Start With the Job—Not the Hype
Gold, silver or Bitcoin? Learn what each is for—and how to size it—before you buy. Read the framework.
By Article Posted by Staff Contributor
American Middle Class / Jan 29, 2026
Florida Homeowners Pay the Most in HOA Fees
Florida HOA fees are surging. See what lawmakers changed, what’s next, and how to protect your budget—read before you buy.
By Article Posted by Staff Contributor
American Middle Class / Jan 29, 2026
Why So Many Homebuyers Are Backing Out of Deals in 2026
Why buyers are backing out of home deals in 2026—and how to avoid costly surprises. Read the playbook before you buy.
By Article Posted by Staff Contributor
American Middle Class / Jan 28, 2026
How Money Habits Form—and Why “Self-Control” Is the Wrong Villain
Learn how money habits form—and how to rewire spending and saving using behavioral science. Read the framework and start today.
By FMC Editorial Team
Latest Reviews
American Middle Class / Feb 18, 2026
How Wealth Is Passed Across Generations in the United States: Mechanisms, Evidence, and the Policy Debate
How wealth passes between generations—trusts, taxes, and the debate. Get the facts, figures, and tradeoffs....
American Middle Class / Feb 16, 2026
The S&P 7,000: How Wall Street Disconnects from Main Street
S&P 7,000 can rise while wages, benefits, and towns fall behind. See why the market...
American Middle Class / Feb 16, 2026
The “Resilient Consumer” Is Real—But So Is the Interest Bill
Credit card balances are rising as savings fall. See what it means—and the 30/60/90 plan...